Abstract
Frontier models increasingly depend on expert-labelled data in domains such as law, medicine, finance and software engineering. In these domains, a label is only as good as the expert who wrote it, and expert judgement is noisy, expensive and unevenly distributed. This paper sets out a quality framework for expert-generated data built on three measurements: agreement between independent experts, calibration of individual experts against gold items, and drift in quality over time. We explain how each measurement is computed, which statistic suits which task type, and how the results should drive decisions about expert selection, retraining and the removal of data. We also describe how to communicate data quality to research audiences without overstating what agreement statistics can show. The paper is written for research leads, data operations teams and marketers who must explain why a dataset can be trusted.
1. Introduction
Public discussion of AI training data often focuses on volume. For specialised domains, the constraint is quality and the scarcity of people who can produce it. A contract clause classification, a differential diagnosis rationale or a code review comment requires training and judgement that cannot be bought in bulk. When such data is noisy, models learn the noise, and evaluations built on the same labels may fail to detect it.
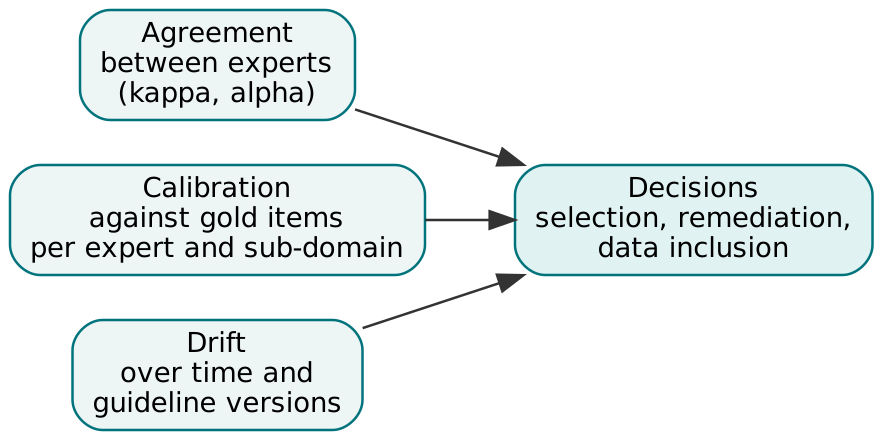
Quality measurement for expert data therefore needs to answer three questions. Do experts agree with one another? Is each expert accurate against items whose answers are known? Has quality changed since the project began? Each question needs a different measurement, and each measurement has known limitations that research communication should acknowledge.
2. Agreement Between Experts
Inter-annotator agreement is the most common quality signal, and the most frequently misreported. Raw percentage agreement is easy to compute but inflated when one label dominates. Cohen’s kappa corrects for chance agreement between two raters on categorical labels. Fleiss’ kappa extends the idea to a fixed number of raters per item. Krippendorff’s alpha handles missing ratings, several raters, and different measurement scales, which makes it the usual choice when experts do not all label the same items.
The statistic should match the task. For a binary judgement such as “the clause is enforceable as written,” kappa or alpha on nominal data is appropriate. For a graded rating such as “the summary is clinically safe on a 1 to 5 scale,” an ordinal or interval-based alpha is more suitable, because disagreeing by one point is less serious than disagreeing by four. For free-text rationales, agreement should be measured on the extracted decision, not on wording.
Agreement is not the same as correctness. Two experts can agree on a wrong answer, particularly where a domain has a common misconception. Agreement therefore sets a ceiling on how reliably a dataset can be learned, but it does not show that the labels are right. This is the reason the second measurement is needed.
Reporting should include the statistic, the number of items and raters used to compute it, the distribution of labels, and a confidence interval where feasible. Kappa values are sensitive to prevalence, so a dataset in which 95 percent of items share one label can show low kappa while agreement is high in practice. Reporting the label distribution alongside the statistic prevents that confusion.
3. Calibration Against Gold Items
Calibration measures each expert’s accuracy on items with verified answers. Gold items can be created by a senior reviewer, drawn from a settled reference source, or constructed with a known answer through a documented procedure. They should be mixed into regular work without being marked, so that experts behave as they would normally.
Calibration results are most useful when they are tracked per expert and per sub-domain. An expert may be strong on contract interpretation and weak on jurisdiction-specific rules. A single overall accuracy figure hides that pattern and leads to poor assignment decisions.
The framework uses three thresholds. Experts above the upper threshold are eligible for review roles. Experts between thresholds continue with feedback. Experts below the lower threshold are paused for retraining and their recent labels are re-checked. The exact thresholds depend on the domain and the cost of error, and should be set by the research lead, not by the operations team alone. Any threshold should be documented with the reason it was chosen.
4. Drift Over Time
Expert quality changes. Guidelines are revised, new edge cases appear, experts become faster and sometimes less careful, and reviewers change their standards. Drift monitoring compares current agreement and calibration with a baseline taken at the start of a project and at each guideline revision.
A simple drift report plots agreement and gold accuracy by week, with markers for guideline changes and expert onboarding. Sudden shifts usually have identifiable causes. Gradual shifts are harder to attribute and often reflect fatigue, changes in task mix, or unclear guidance that experts have interpreted differently over time.
Drift also affects the reuse of existing data. Labels produced under an old guideline may not be comparable with labels produced under a revised one. The dataset card should record which guideline version each item was labelled under.
5. Decisions the Measurements Should Drive
Quality measurement is only useful if it changes decisions. Three decisions follow directly from the framework. The first is expert selection: which experts are invited into a project, and which are moved into review roles. The second is remediation: which items should be relabelled, and which experts should receive targeted retraining. The third is data inclusion: which items should be excluded from training or evaluation, and how the exclusions are reported.
A common mistake is to remove all items with low agreement. Low agreement can indicate a genuinely ambiguous item, which may be valuable to keep, labelled with its ambiguity, or used to test model calibration. Removing ambiguous items can make a dataset look clean while teaching a model that every question has one answer. The framework therefore distinguishes errors, which are relabelled or removed, from ambiguity, which is flagged and retained where it reflects the domain.
6. Communicating Quality Without Overclaiming
Research audiences respond well to quality metrics, which makes them easy to overstate. A dataset described as “validated by experts with 0.85 kappa” invites the question of what was validated, against what standard, and on which items. Better wording names the statistic, the sample, the rater count, and what the statistic does not show. For example: “On 400 items labelled independently by three practitioners, Krippendorff’s alpha was 0.78 for the enforceability question; agreement with a senior reviewer on 60 gold items was 91 percent. The gold items were drawn from a single jurisdiction.”
Marketing materials should also avoid implying that expert data is superior to all alternatives. The honest claim is that the process was measured, the measurements are published, and the limits are stated.
7. Anonymised Illustration
In a previous role managing weekly reporting across multiple client accounts, the author introduced a sign-off check in which the person preparing each report recorded a quality score for the data sources used, including the proportion of conversions that could be matched to the source platform. Over several cycles, the check revealed that a subset of accounts had tracking gaps that made their comparisons unreliable. Flagging these gaps changed how the results were presented and led to a tracking fix, rather than a misleading ranking of account performance.
The parallel to expert data is the habit of measuring the inputs, not only the outputs.
8. Limitations
The framework assumes that gold items are correct and representative. If they are not, calibration will reward experts who agree with the gold source rather than those who are right. The framework also cannot detect a shared error across all experts unless an independent reference exists. Finally, agreement statistics depend on the specific item mix, so a result from one project should not be assumed to transfer to another without re-measurement.
9. Conclusion
Expert data quality can be measured with three complementary tools: agreement, calibration and drift. None is sufficient alone. Used together, and reported with their assumptions, they give research teams a defensible basis for decisions about who labels, what is kept, and what can be claimed about a dataset.
References
Cohen, J. (1960). A coefficient of agreement for nominal scales. Educational and Psychological Measurement, 20(1).
Krippendorff, K. (2011). Computing Krippendorff’s alpha-reliability. Annenberg School for Communication, University of Pennsylvania.
Gebru, T., Morgenstern, J., Vecchione, B., Vaughan, J. W., Wallach, H., Daumé III, H., and Crawford, K. (2018). Datasheets for datasets. arXiv preprint.
Mitchell, M., Wu, S., Zaldivar, A., Barnes, P., Vasserman, L., Hutchinson, B., Spitzer, E., Raji, I. D., and Gebru, T. (2019). Model cards for model reporting. Proceedings of the ACM Conference on Fairness, Accountability, and Transparency.